Electrical Engineering Gate Yearwise
Electrical Gate 2024
Electrical Gate 2023
Electrical Gate 2022
Electrical Gate 2021
Electrical Gate 2020
Electrical Gate 2019
Electrical Gate 2018
Electrical Gate 2017 (Set 1)
Electrical Gate 2017 (Set 2)
Electrical Gate 2016 (Set 1)
Electrical Gate 2016 (Set 2)
Electrical Gate 2015 (Set 1)
Electrical Gate 2015 (Set 2)
Electrical Gate 2014 (Set 1)
Electrical Gate 2014 (Set 2)
Electrical Gate 2014 (Set 3)
Electrical Gate 2013 (Set 1)
Electrical Gate 2013 (Set 2)
Electrical Gate 2013 (Set 3)
Electrical Engineering Gate 2015 Set-1 Questions with Answer
Ques 1 GATE 2015 SET-1
Of the four characteristics given below, which are the major requirements for an instrumentation amplifier?
P. High common mode rejection ratio
Q. High input impedance
R. High linearity
S. High output impedance
Ques 2 GATE 2015 SET-1
Consider the circuit shown in the figure. In this circuit R=1kΩ, and C=1μF. The input voltage is sinusoidal with a frequency of 50 Hz, represented as a phasor with magnitude Vi and phase angle 0 radian as shown in the figure. The output voltage is represented as a phasor with magnitude Vo and phase angle δ radian. What is the value of the output phase angle δ (in radian) relative to the phase angle of the input voltage?

Ques 3 GATE 2015 SET-1
In the given circuit, the silicon transistor has β=75 and a collector voltage VC=9V. Then the ratio of RB and RC is ________.

Ques 4 GATE 2015 SET-1
The op-amp shown in the figure has a finite gain A=1000 and an infinite input resistance. A step-voltage Vi=1mV is applied at the input at time t=0 as shown. Assuming that the operational amplifier is not saturated, the time constant (in millisecond) of the output voltage Vo is

Ques 5 GATE 2015 SET-1
The voltages developed across the 3Ω and 2Ω resistors shown in the figure are 6V and 2V respectively, with the polarity as marked. What is the power (in Watt) delivered by the 5V voltage source?

Ques 6 GATE 2015 SET-1
For the given circuit, the Thevenin equivalent is to be determined. The Thevenin voltage, VTh (in Volt), seen from terminal AB is ________.

Ques 7 GATE 2015 SET-1
An inductor is connected in parallel with a capacitor as shown in the figure. As the frequency of current i is increased, the impedance (Z) of the network varies as

Ques 8 GATE 2015 SET-1
The circuit shown in the figure has two sources connected in series. The instantaneous voltage of the AC source (in Volt) is given by v(t) = 12sint. If the circuit is in steady state, then the rms value of the current (in Ampere) flowing in the circuit is ________.

Ques 9 GATE 2015 SET-1
In a linear two-port network, when 10 V is applied to Port 1, a current of 4 A flows through Port 2 when it is short-circuited. When 5 V is applied to Port 1, a current of 1.25 A flows through a 1 Ω resistance connected across Port 2. When 3 V is applied to Port 1, the current (in Ampere) through a 2 Ω resistance connected across Port 2 is ________.
Ques 10 GATE 2015 SET-1
In the given circuit, the parameter k is positive, and the power dissipated in the 2 Ω resistor is 12.5W. The value of k is ________.

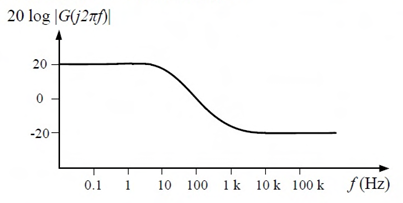
Ques 11 GATE 2015 SET-1
A Bode magnitude plot for the transfer function G(s) of a plant is shown in the figure. Which one of the following transfer functions best describes the plant?
Ques 12 GATE 2015 SET-1
For the signal-flow graph shown in the figure, which one of the following expressions is equal to the transfer function Y(s)/X2(s) |X1(s)=0?

Ques 13 GATE 2015 SET-1
In the signal flow diagram given in the figure, u1 and u2 are possible inputs whereas y1 and y2 are possible outputs. When would the SISO system derived from this diagram be controllable and observable?


Total Unique Visitors