Textile Engineering > GATE 2018 > Data Interpretation
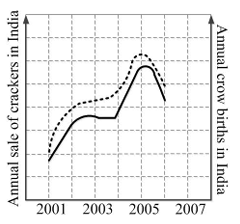
In a detailed study of annual crow births in India, it was found that there was relatively no growth during the period 2002 to 2004 and a sudden spike from 2004 to 2005. In another unrelated study, it was found that the revenue from cracker sales in India which remained fairly flat from 2002 to 2004, saw a sudden spike in 2005 before declining again in 2006. The solid line in the graph below refers to annual sale of crackers and the dashed line refers to the annual crow births in India. Choose the most appropriate inference from the above data.
Correct : a
Similar Questions
The pie chart presents the percentage contribution of different macronutrients to a
typical 2,000 kcal diet of a person.
The typical energy density (kcal/...
The following graph represents the installed capacity for cement production (in tonnes) and the actual production (in tonnes) of nine cement plants of a cement...
The total exports and revenues from the exports of a country are given in the two pie charts below. The pie chart for exports shows the quantity of each item as...

Total Unique Visitors
Loading......