Textile Engineering > GATE 2016 > Data Interpretation
The following graph represents the installed capacity for cement production (in tonnes) and the actual production (in tonnes) of nine cement plants of a cement company. Capacity utilization of a plant is defined as ratio of actual production of cement to installed capacity. A plant with installed capacity of at least 200 tonnes is called a large plant and a plant with lesser capacity is called a small plant. The difference between total production of large plants and small plants, in tonnes is
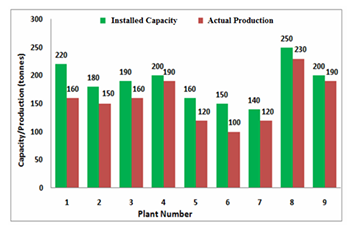
Correct : 120: 120
Similar Questions
The pie chart presents the percentage contribution of different macronutrients to a
typical 2,000 kcal diet of a person.
The typical energy density (kcal/...
In a detailed study of annual crow births in India, it was found that there was relatively no growth during the period 2002 to 2004 and a sudden spike from 2004...
The total exports and revenues from the exports of a country are given in the two pie charts below. The pie chart for exports shows the quantity of each item as...

Total Unique Visitors
Loading......