Textile Engineering > GATE 2014 > Data Interpretation
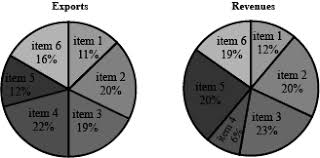
The total exports and revenues from the exports of a country are given in the two pie charts below. The pie chart for exports shows the quantity of each item as a percentage of the total quantity of exports. The pie chart for the revenues shows the percentage of the total revenue generated through export of each item. The total quantity of exports of all the items is 5 lakh tonnes and the total revenues are 250 crore rupees. What is the ratio of the revenue generated through export of Item 1 per kilogram to the revenue generated through export of Item 4 per kilogram?
Correct : d
Similar Questions
The pie chart presents the percentage contribution of different macronutrients to a
typical 2,000 kcal diet of a person.
The typical energy density (kcal/...
In a detailed study of annual crow births in India, it was found that there was relatively no growth during the period 2002 to 2004 and a sudden spike from 2004...
The following graph represents the installed capacity for cement production (in tonnes) and the actual production (in tonnes) of nine cement plants of a cement...

Total Unique Visitors
Loading......