Textile Engineering > GATE 2011 > Data Interpretation
The quality of services delivered by a company consists of six factors as shown below in the radar diagram. The dots in the figure indicate the score for each factor on a scale of 0 to 10. The standardized coefficient for each factor is given in the parentheses. The contribution of each factor to the overall service quality is directly proportional to the factor score and its standardized coefficient.
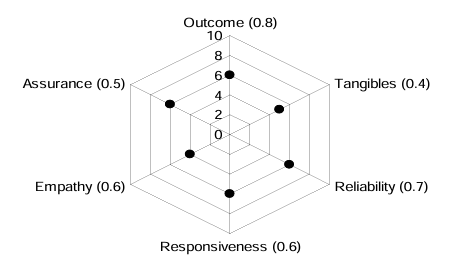 The lowest contribution among all the above factors to the overall quality of services delivered by the company is
Correct : b
Similar Questions
The pie chart presents the percentage contribution of different macronutrients to a
typical 2,000 kcal diet of a person.
The typical energy density (kcal/...
In a detailed study of annual crow births in India, it was found that there was relatively no growth during the period 2002 to 2004 and a sudden spike from 2004...
The following graph represents the installed capacity for cement production (in tonnes) and the actual production (in tonnes) of nine cement plants of a cement...

Total Unique Visitors
Loading......