Mining Engineering > GATE 2025 > Data Interpretation
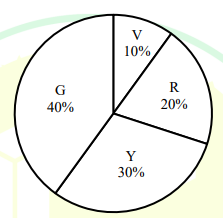
A bag contains Violet (V), Yellow (Y), Red (R), and Green (G) balls. On counting them, the following results are obtained:
(i) The sum of Yellow balls and twice the number of Violet balls is 50.
(ii) The sum of Violet and Green balls is 50.
(iii) The sum of Yellow and Red balls is 50.
(iv) The sum of Violet and twice the number of Red balls is 50.
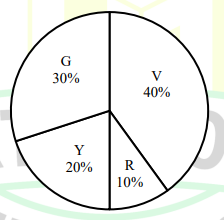
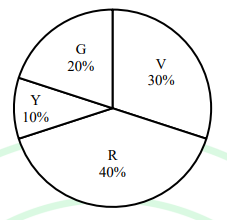
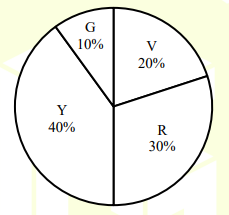
Which one of the following Pie charts correctly represents the balls in the bag?
![]()
(i) The sum of Yellow balls and twice the number of Violet balls is 50.
(ii) The sum of Violet and Green balls is 50.
(iii) The sum of Yellow and Red balls is 50.
(iv) The sum of Violet and twice the number of Red balls is 50.
Which one of the following Pie charts correctly represents the balls in the bag?
A
B
C
D
Correct : a
Similar Questions
The plot below shows the relationship between the mortality risk of cardiovascular disease and the number of steps a person walks per day. Based on the data, wh...
The closest match of the scatter plot between the variables X and Y with the approximate attribute is
The profit shares of two companies P and Q are shown in the figure. If the two companies have invested a fixed and equal amount every year, then the ratio of th...

Total Unique Visitors
Loading......