Metallurgical Engineering > GATE 2024 > Kinetics
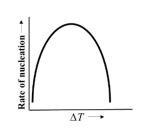
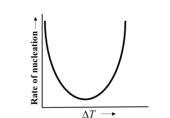
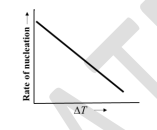
Which one of the following schematics represents the variation of the rate of nucleation of solid from a pure liquid metal as a function of undercooling (ΔT = Tm - T, where Tm and T are the freezing temperature and the liquid temperature, respectively)?
A
B
C
D
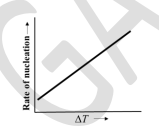
Correct : a
Similar Questions
For a solid embryo in contact with a perfectly flat mould wall as shown in the schematic, the wetting angle θ is _______ degrees.
(Round off to one de...
A non-porous spherical Fe2O3 particle of initial radius of 5 × 10⁻² m is topo-chemically reduced by H2 where the reactant-product interface is sharp and s...
The rate constant of a reaction at 400 K is three times the value at 300 K. The activation energy of the reaction in kJ⋅mol-1 is _______ (round off to 1 decimal...

Total Unique Visitors
Loading......