Metallurgical Engineering > GATE 2024 > Material Science
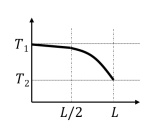
As shown in the figure, two rods of different metals of equal lengths L/2, diameter d (d << L), and constant thermal conductivities k1 and k2 (with k1 > k2) are connected perfectly (i.e., zero interface thermal resistance).
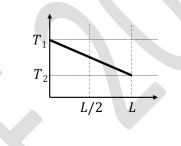
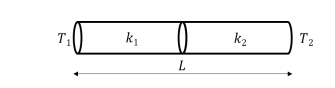 The left and right ends of the connected rod are maintained at temperatures T1 and T2 (T1 > T2). Assume that the rods are insulated from the environment, apart from the two flat ends. Which one of the following graphs represents the temperature distribution at steady-state? The thickest line shows the temperature profile. The horizontal axis shows the distance from the left end of the rod to the right and the vertical axis denotes temperature.
A
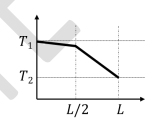
B
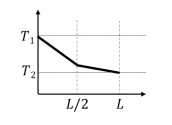
C
D
Correct : c
Similar Questions
Diamond has low _______.
Match Column I with Column II.
Mr. X speaks _________ Japanese _________ Chinese.

Total Unique Visitors
Loading......