Metallurgical Engineering > GATE 2020 > Data Interpretation
The bar graph shows the data of the students who appeared and passed in an examination for four schools P, Q, R and S. The average of success rates (in percentage) of these four schools is _______.
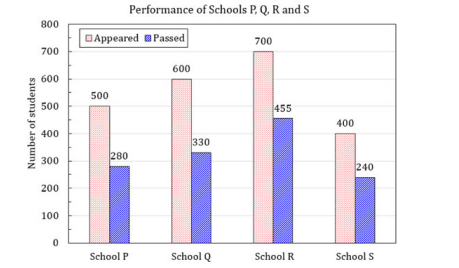
Correct : c
Similar Questions
The pie chart presents the percentage contribution of different macronutrients to a
typical 2,000 kcal diet of a person.
The typical energy density (kcal/...
Mr. X speaks _________ Japanese _________ Chinese.
A sum of money is to be distributed among P, Q, R, and S in the
proportion 5 : 2 : 4 : 3, respectively.
If R gets ₹ 1000 more than S, what is the share of Q (...

Total Unique Visitors
Loading......