Mechanical Engineering > GATE 2017 SET-1 > Data Interpretation
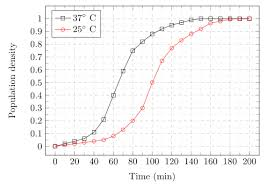
The growth of bacteria (lactobacillus) in milk leads to curd formation. A minimum bacterial population density of 0.8 (in suitable units) is needed to form curd. In the graph below, the population density of lactobacillus in 1 litre of milk is plotted as a function of time, at two different temperatures, 25°C and 37°C.
 Consider the following statements based on the data shown above:
i. The growth in bacterial population stops earlier at 37°C as compared to 25°C.
ii. The time taken for curd formation at 25°C is twice the time taken at 37°C.
Which one of the following options is correct?
i. The growth in bacterial population stops earlier at 37°C as compared to 25°C.
ii. The time taken for curd formation at 25°C is twice the time taken at 37°C.
Which one of the following options is correct?
Correct : a
Similar Questions
A certain country has 504 universities and 25951 colleges. These are categorised into Grades I, II, and III as shown in the given pie charts. What is the percen...
The statistics of runs scored in a series by four batsmen are provided in the following table. Who is the most consistent batsman of these four?
The exports and imports (in crores of Rs.) of a country from 2000 to 2007 are give are given in the following bar chart. If the trade deficit is defined as exce...

Total Unique Visitors
Loading......