Mechanical Engineering > GATE 2016 SET-3 > Data Interpretation
The Venn diagram shows the preference of the student population for leisure activities. From the data given, the number of students who like to read books or play sports is
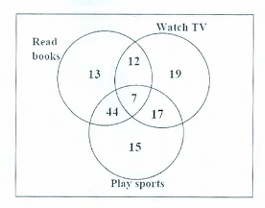
Correct : d
Similar Questions
A certain country has 504 universities and 25951 colleges. These are categorised into Grades I, II, and III as shown in the given pie charts. What is the percen...
The statistics of runs scored in a series by four batsmen are provided in the following table. Who is the most consistent batsman of these four?
The exports and imports (in crores of Rs.) of a country from 2000 to 2007 are give are given in the following bar chart. If the trade deficit is defined as exce...

Total Unique Visitors
Loading......