Mechanical Engineering > GATE 2014 Set-4 > Data Interpretation
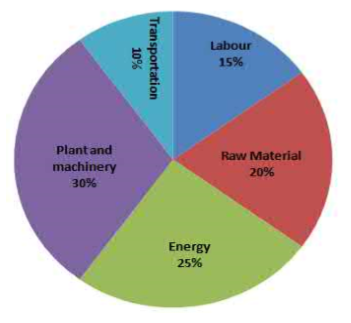
A firm producing air purifiers sold 200 units in 2012. The following pie chart presents the share of raw material, labour, energy, plant & machinery, and transportation costs in the total manufacturing cost of the firm in 2012. The expenditure on labour in 2012 is Rs. 4,50,000. In 2013, the raw material expenses increased by 30% and all other expenses increased by 20%. What is the percentage increase in total cost for the company in 2013?
Correct : 22
Similar Questions
A certain country has 504 universities and 25951 colleges. These are categorised into Grades I, II, and III as shown in the given pie charts. What is the percen...
The statistics of runs scored in a series by four batsmen are provided in the following table. Who is the most consistent batsman of these four?
The exports and imports (in crores of Rs.) of a country from 2000 to 2007 are give are given in the following bar chart. If the trade deficit is defined as exce...

Total Unique Visitors
Loading......