Mechanical Engineering > GATE 2014 SET-2 > Data Interpretation
The total exports and revenues from the exports of a country are given in the two charts shown below. The pie chart for exports shows the quantity of each item exported as a percentage of the total quantity of exports. The pie chart for the revenues shows the percentage of the total revenue generated through export of each item. The total quantity of exports of all the items is 500 thousand tonnes and the total revenues are 250 crore rupees.
Which item among the following has generated the maximum revenue per kg?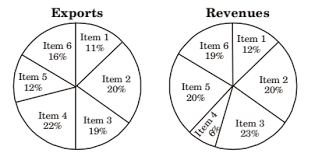
Which item among the following has generated the maximum revenue per kg?
Correct : item 5
Similar Questions
A certain country has 504 universities and 25951 colleges. These are categorised into Grades I, II, and III as shown in the given pie charts. What is the percen...
The statistics of runs scored in a series by four batsmen are provided in the following table. Who is the most consistent batsman of these four?
The exports and imports (in crores of Rs.) of a country from 2000 to 2007 are give are given in the following bar chart. If the trade deficit is defined as exce...

Total Unique Visitors
Loading......