Electrical Engineering > GATE 2015 SET-1 > Bode Plots
A Bode magnitude plot for the transfer function G(s) of a plant is shown in the figure. Which one of the following transfer functions best describes the plant?
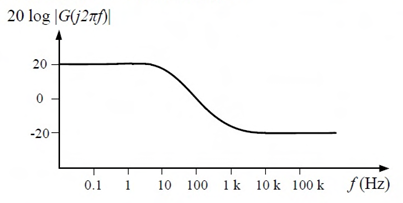
Correct : b
Similar Questions
The Bode magnitude plot for the transfer function Vo(s) / Vi(s) of the circuit is as shown. The value of R is _______ Ω. (Round off to 2 decimal places.)
Consider the unity feedback control system shown. The value of K that results in a phase margin of the system to be 30° is ___________. (Give the answer up...
Consider the following asymptotic Bode magnitude plot (ω is in rad/s). Which one of the following transfer functions is best represented by the above Bode magni...

Total Unique Visitors
Loading......