EC > GATE 2022 > Probability Theory
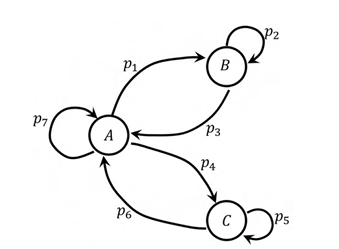
A state transition diagram with states A, B, and C, and transition probabilities p1, p2, …, p7 is shown in the figure (e.g., p1 denotes the probability of transition from state A to B). For this state diagram, select the statement(s) which is/are universally true.
Correct : c
Similar Questions
Mr. X speaks _________ Japanese _________ Chinese.
A sum of money is to be distributed among P, Q, R, and S in the
proportion 5 : 2 : 4 : 3, respectively.
If R gets ₹ 1000 more than S, what is the share of Q (...
A trapezium has vertices marked as P, Q, R and S (in that order anticlockwise).
The side PQ is parallel to side SR.
Further, it is given that, PQ = 11 cm, QR...

Total Unique Visitors
Loading......