EC > GATE 2019 > Data Interpretation
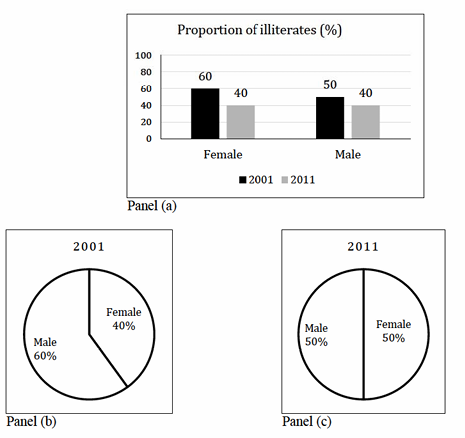
The bar graph in Panel (a) shows the proportion of male and female illiterates in 2001 and 2011. The proportions of males and females in 2001 and 2011 are given in Panel (b) and (c), respectively. The total population did not change during this period. The percentage increase in the total number of literates from 2001 to 2011 is
Correct : a
Similar Questions
The bar chart shows the data for the percentage of population falling into different categories based on Body Mass Index (BMI) in 2003 and 2023.
Based on the...
The table lists the top 5 nations according to the number of gold medals won in a tournament; also included are the number of silver and the bronze medals won b...
The following figure shows the data of students enrolled in 5 years (2014 to 2018) for two schools P and Q. During this period, the ratio of the average number...

Total Unique Visitors
Loading......