EC > GATE 2019 > Semiconductor Physics
Which one of the following options describes correctly the equilibrium band diagram at T=300 K of a Silicon pmn+p++ configuration shown in the figure?
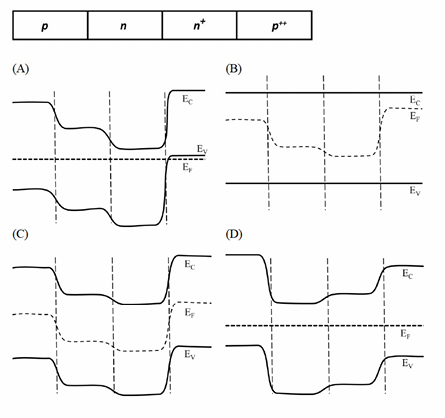
Correct : a
Similar Questions
For non-degenerately doped n-type silicon, which one of the following plots represents the temperature (T) dependence of free electron concentration (n)?
The free electron concentration profile n(x) in a doped semiconductor at equilibrium is shown in the figure, where the points A, B, and C mark three different p...
A non-degenerate n-type semiconductor has 5% neutral dopant atoms.
Its Fermi level is located at 0.25 eV below the conduction band (EC) and the donor energy le...

Total Unique Visitors
Loading......