EC > GATE 2015 SET-3 > PN Junctions
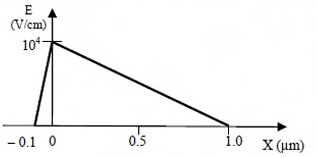
The electric field profile in the depletion region of a p-n junction in equilibrium is shown in the figure. Which one of the following statements is NOT TRUE?
Correct : c
Similar Questions
Mr. X speaks _________ Japanese _________ Chinese.
A sum of money is to be distributed among P, Q, R, and S in the
proportion 5 : 2 : 4 : 3, respectively.
If R gets ₹ 1000 more than S, what is the share of Q (...
A trapezium has vertices marked as P, Q, R and S (in that order anticlockwise).
The side PQ is parallel to side SR.
Further, it is given that, PQ = 11 cm, QR...

Total Unique Visitors
Loading......