EC > GATE 2014 SET-4 > Data Interpretation
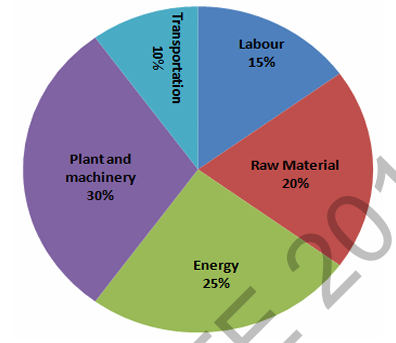
A firm producing air purifiers sold 200 units in 2012. The following pie chart presents the share of raw material, labour, energy, plant & machinery, and transportation costs in the total manufacturing cost of the firm in 2012. The expenditure on labour in 2012 is Rs. 4,50,000. In 2013, the raw material expenses increased by 30% and all other expenses increased by 20%. What is the percentage increase in total cost for the company in 2013?
Correct : 22
Similar Questions
The bar chart shows the data for the percentage of population falling into different categories based on Body Mass Index (BMI) in 2003 and 2023.
Based on the...
The table lists the top 5 nations according to the number of gold medals won in a tournament; also included are the number of silver and the bronze medals won b...
The following figure shows the data of students enrolled in 5 years (2014 to 2018) for two schools P and Q. During this period, the ratio of the average number...

Total Unique Visitors
Loading......