EC > GATE 2014 SET-4 > Semiconductor Physics
In the figure, ln(ρi) is plotted as a function of 1/T, where ρi is the intrinsic resistivity of silicon, T is the temperature, and the plot is almost linear.
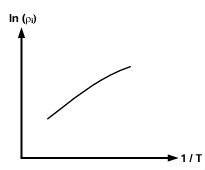 The slope of the line can be used to estimate
Correct : a
Similar Questions
For non-degenerately doped n-type silicon, which one of the following plots represents the temperature (T) dependence of free electron concentration (n)?
The free electron concentration profile n(x) in a doped semiconductor at equilibrium is shown in the figure, where the points A, B, and C mark three different p...
A non-degenerate n-type semiconductor has 5% neutral dopant atoms.
Its Fermi level is located at 0.25 eV below the conduction band (EC) and the donor energy le...

Total Unique Visitors
Loading......