EC > GATE 2014 SET-2 > Data Interpretation
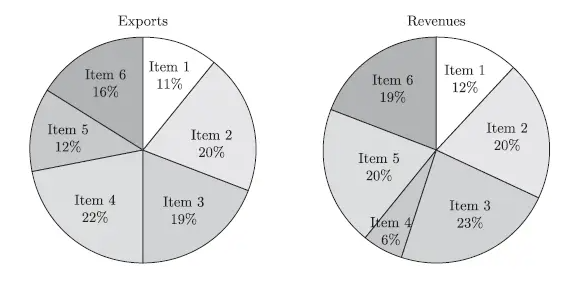
The total exports and revenues from the exports of a country are given in the two charts shown. The pie chart for exports shows the quantity of each item exported as a percentage of the total quantity of exports. The pie chart for the revenues shows the percentage of the total revenue generated through export of each item. The total quantity of exports of all the items is 500 thousand tonnes and the total revenues are 250 crore rupees. Which item among the following has generated the maximum revenue per kg?
Correct : d
Similar Questions
The bar chart shows the data for the percentage of population falling into different categories based on Body Mass Index (BMI) in 2003 and 2023.
Based on the...
The table lists the top 5 nations according to the number of gold medals won in a tournament; also included are the number of silver and the bronze medals won b...
The following figure shows the data of students enrolled in 5 years (2014 to 2018) for two schools P and Q. During this period, the ratio of the average number...

Total Unique Visitors
Loading......