EC > GATE 2014 SET-1 > Data Interpretation
The exports and imports (in crores of Rs.) of a country from 2000 to 2007 are given in the bar chart. If the trade deficit is defined as excess of imports over exports, in which year is the trade deficit 1/5th of the exports?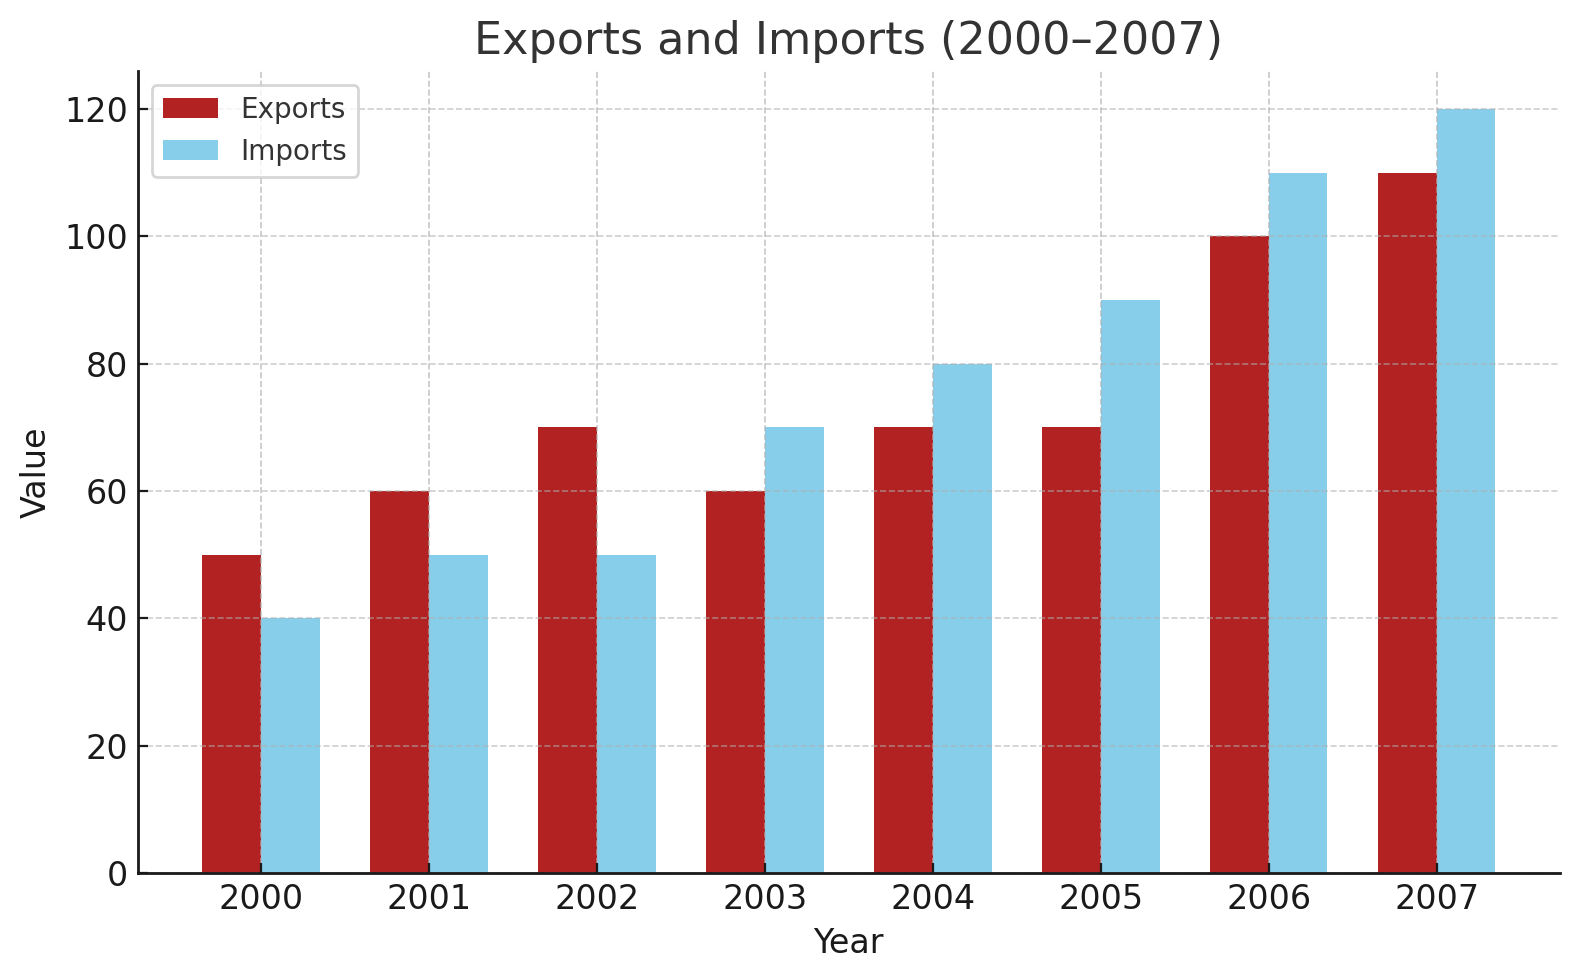
Correct : d
Similar Questions
The bar chart shows the data for the percentage of population falling into different categories based on Body Mass Index (BMI) in 2003 and 2023.
Based on the...
The table lists the top 5 nations according to the number of gold medals won in a tournament; also included are the number of silver and the bronze medals won b...
The following figure shows the data of students enrolled in 5 years (2014 to 2018) for two schools P and Q. During this period, the ratio of the average number...

Total Unique Visitors
Loading......