EC > GATE 2013 SET-1 > Frequency Response
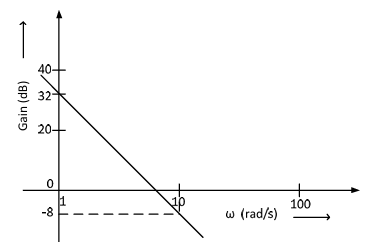
The Bode plot of a transfer function G(s) is shown in the figure below. The gain 20log|G(s)| is 32 dB and −8 dB at 1 rad/s and 10 rad/s respectively. The phase is negative for all ω. Then G(s) is
Correct : b
Similar Questions
The open loop transfer function of a unity negative feedback system is G(s) = k/s(1 + sT1)(1 + sT2). where k, T1 and T2 are positive constants. The phase cross-...
The Nyquist plot of a system is given in the figure below. Let ωP, ωQ, ωR, and ωS be the positive frequencies at the points P, Q, R, and...
A system with transfer function G(s)=1/((s+1)(s+a)), a>0 is subjected to an input 5cos 3t. The steady state output of the system is 1/√10 cos(3t-1.892). The val...

Total Unique Visitors
Loading......