Civil Engineering > GATE 2025 SET-2 > Data Interpretation
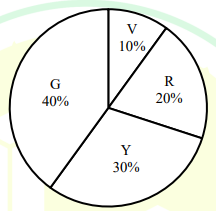
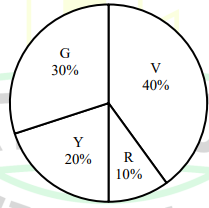
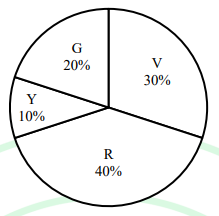
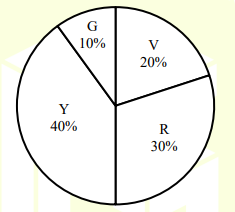
A bag contains Violet (V), Yellow (Y), Red (R), and Green (G) balls. On counting them, the following results are obtained:
(i) The sum of Yellow balls and twice the number of Violet balls is 50.
(ii) The sum of Violet and Green balls is 50.
(iii) The sum of Yellow and Red balls is 50.
(iv) The sum of Violet and twice the number of Red balls is 50.
Which one of the following Pie charts correctly represents the balls in the bag?
![]()
(i) The sum of Yellow balls and twice the number of Violet balls is 50.
(ii) The sum of Violet and Green balls is 50.
(iii) The sum of Yellow and Red balls is 50.
(iv) The sum of Violet and twice the number of Red balls is 50.
Which one of the following Pie charts correctly represents the balls in the bag?
A
B
C
D
Correct : a
Similar Questions
The bar graph below shows the output of five carpenters over one month, each of whom made different items of furniture: chairs, tables, and beds.
Consider th...
The points in the graph below represent the halts of a lift for durations of 1 minute, over a period of 1 hour.
Which of the following statements are correct?...
The total expenditure of a family, on different activities in a month, is shown in the pie-chart. The extra money spent on education as compared to transport (i...

Total Unique Visitors
Loading......