Civil Engineering > GATE 2024 SET-2 > Data Interpretation
The plot below shows the relationship between the mortality risk of cardiovascular disease and the number of steps a person walks per day. Based on the data, which one of the following options is true?
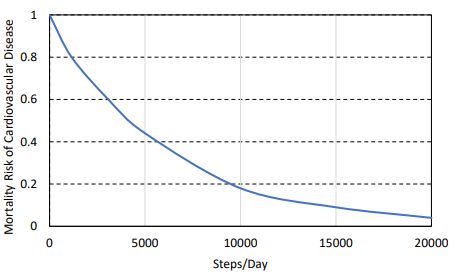
Correct : c
Similar Questions
The bar graph below shows the output of five carpenters over one month, each of whom made different items of furniture: chairs, tables, and beds.
Consider th...
The points in the graph below represent the halts of a lift for durations of 1 minute, over a period of 1 hour.
Which of the following statements are correct?...
The total expenditure of a family, on different activities in a month, is shown in the pie-chart. The extra money spent on education as compared to transport (i...

Total Unique Visitors
Loading......