Civil Engineering > GATE 2024 SET-1 > Data Interpretation
The chart given below compares the Installed Capacity (MW) of four power generation technologies, T1, T2, T3, and T4, and their Electricity Generation (MWh) in a time of 1000 hours (h).
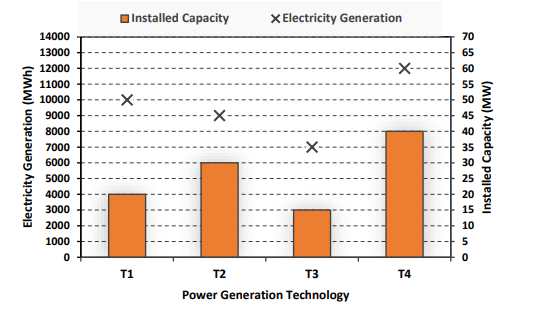 Installed Capacity X Electricity Generation. The Capacity Factor of a power generation technology is:
Capacity Factor = Electricity Generation (MWh) / Installed Capacity (MW) x 1000 (h).
Which one of the given technologies has the highest Capacity Factor?
Capacity Factor = Electricity Generation (MWh) / Installed Capacity (MW) x 1000 (h).
Which one of the given technologies has the highest Capacity Factor?
Correct : a
Similar Questions
The bar graph below shows the output of five carpenters over one month, each of whom made different items of furniture: chairs, tables, and beds.
Consider th...
The points in the graph below represent the halts of a lift for durations of 1 minute, over a period of 1 hour.
Which of the following statements are correct?...
The total expenditure of a family, on different activities in a month, is shown in the pie-chart. The extra money spent on education as compared to transport (i...

Total Unique Visitors
Loading......