Civil Engineering > GATE 2020 SET-2 > Data Interpretation
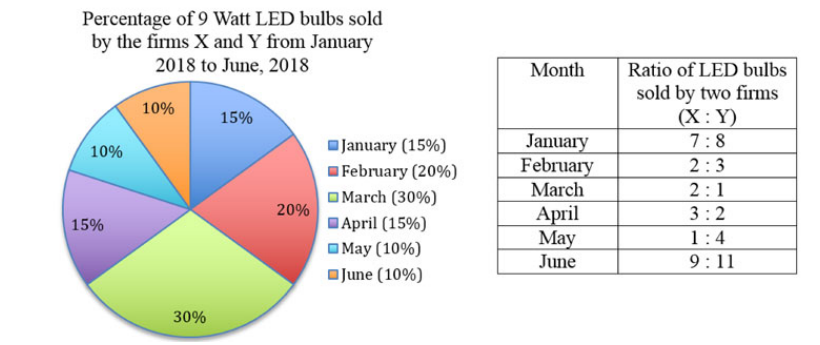
The monthly distribution of 9 Watt LED bulbs sold by two firms X and Y from January to June 2018 is shown in the pie-chart and the corresponding table. If the total number of LED bulbs sold by two firms during April-June 2018 is 50000, then the number of LED bulbs sold by the firm Y during April-June 2018 is
Correct : c
Similar Questions
The bar graph below shows the output of five carpenters over one month, each of whom made different items of furniture: chairs, tables, and beds.
Consider th...
The points in the graph below represent the halts of a lift for durations of 1 minute, over a period of 1 hour.
Which of the following statements are correct?...
The total expenditure of a family, on different activities in a month, is shown in the pie-chart. The extra money spent on education as compared to transport (i...

Total Unique Visitors
Loading......