Civil Engineering > GATE 2020 SET-1 > Transportation Engineering
The relationship between traffic flow rate (q) and density (D) is shown in the figure.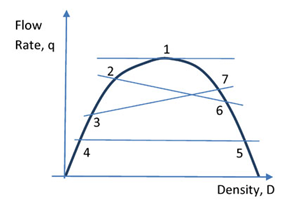 The shock wave condition is depicted by
Correct : c
Similar Questions
A super-elevation e is provided on a circular horizontal curve such that a vehicle can be stopped on the curve without sliding. Assuming a design speed v and ma...
A runway is being constructed in a new airport as per the International Civil Aviation Organization (ICAO) recommendations. The elevation and the airport refere...
Vehicles arriving at an intersection from one of the approach roads follow the Poisson distribution. The mean rate of arrival is 900 vehicles per hour. If a gap...

Total Unique Visitors
Loading......