Civil Engineering > GATE 2018 SET-2 > Environmental Engineering
In the figures, Group I represents the atmospheric temperature profiles (P, Q, R and S) and Group II represents dispersion of pollutants from a smoke stack (1, 2, 3 and 4). In the figures of Group I, the dashed line represents the dry adiabatic lapse rate, whereas the horizontal axis represents temperature and the vertical axis represents the altitude.
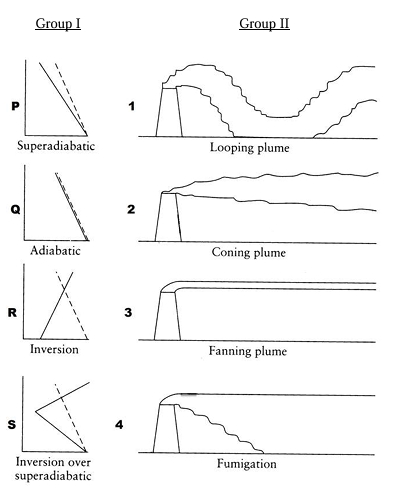 The correct match is
Correct : a
Similar Questions
The reaction rate involving reactants A and B is given by -k[A]α[B]β. Which one of the following statements is valid for the reaction to be a first-order reacti...
The wastewater from a city, containing a high concentration of biodegradable organics, is being steadily discharged into a flowing river at a location S. If the...
Which one of the following is NOT present in the acid rain?

Total Unique Visitors
Loading......