Civil Engineering > GATE 2017 SET-1 > Data Interpretation
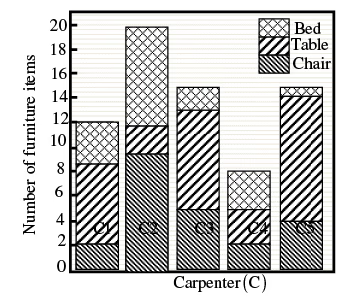
The bar graph below shows the output of five carpenters over one month, each of whom made different items of furniture: chairs, tables, and beds.
 Consider the following statements.
i. The number of beds made by carpenter C2 is exactly the same as the number of tables made by carpenter C3.
ii. The total number of chairs made by all carpenters is less than the total number of tables.
Which one of the following is true?
i. The number of beds made by carpenter C2 is exactly the same as the number of tables made by carpenter C3.
ii. The total number of chairs made by all carpenters is less than the total number of tables.
Which one of the following is true?
Correct : c
Similar Questions
The points in the graph below represent the halts of a lift for durations of 1 minute, over a period of 1 hour.
Which of the following statements are correct?...
The total expenditure of a family, on different activities in a month, is shown in the pie-chart. The extra money spent on education as compared to transport (i...
The monthly distribution of 9 Watt LED bulbs sold by two firms X and Y from January to June 2018 is shown in the pie-chart and the corresponding table. If the t...

Total Unique Visitors
Loading......