Civil Engineering > GATE 2017 SET-1 > Transportation Engineering
The queue length (in number of vehicles) versus time (in seconds) plot for an approach to a signalized intersection with the cycle length of 96 seconds is shown in the figure (not drawn to scale).
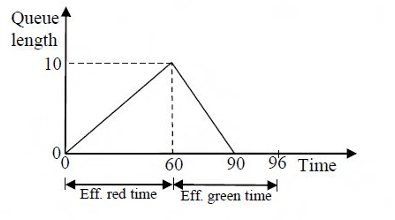 At time t = 0, the light has just turned red. The effective green time is 36 seconds, during which vehicles discharge at the saturation flow rate, s (in vph). Vehicles arrive at a uniform rate, v (in vph), throughout the cycle. Which one of the following statements is TRUE?
Correct : b
Similar Questions
A super-elevation e is provided on a circular horizontal curve such that a vehicle can be stopped on the curve without sliding. Assuming a design speed v and ma...
A runway is being constructed in a new airport as per the International Civil Aviation Organization (ICAO) recommendations. The elevation and the airport refere...
Vehicles arriving at an intersection from one of the approach roads follow the Poisson distribution. The mean rate of arrival is 900 vehicles per hour. If a gap...

Total Unique Visitors
Loading......