Civil Engineering > GATE 2015 SET-1 > Data Interpretation
The exports and imports (in crores of Rs.) of a country from the year 2000 to 2007 are given in the following bar chart. In which year is the combined percentage increase in imports and exports the highest?
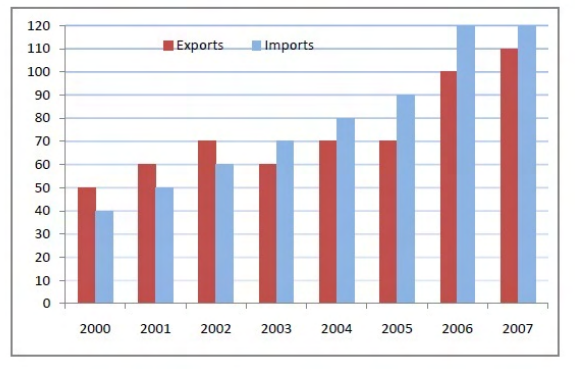
Correct : 2006
Similar Questions
The bar graph below shows the output of five carpenters over one month, each of whom made different items of furniture: chairs, tables, and beds.
Consider th...
The points in the graph below represent the halts of a lift for durations of 1 minute, over a period of 1 hour.
Which of the following statements are correct?...
The total expenditure of a family, on different activities in a month, is shown in the pie-chart. The extra money spent on education as compared to transport (i...

Total Unique Visitors
Loading......