Civil Engineering > GATE 2014 SET-1 > Data Interpretation
The monthly rainfall chart based on 50 years of rainfall in Agra is shown in the following figure. Which of the following are true? (k percentile is the value such that k percent of the data fall below that value) 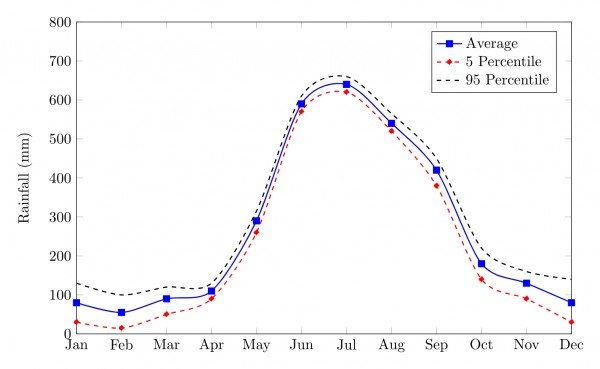
(i) On average, it rains more in July than in December.
(ii) Every year, the amount of rainfall in August is more than that in January.
(iii) July rainfall can be estimated with better confidence than February rainfall.
(iv) In August, there is at least 500 mm of rainfall.
(i) On average, it rains more in July than in December.
(ii) Every year, the amount of rainfall in August is more than that in January.
(iii) July rainfall can be estimated with better confidence than February rainfall.
(iv) In August, there is at least 500 mm of rainfall.
Correct : a
Similar Questions
The bar graph below shows the output of five carpenters over one month, each of whom made different items of furniture: chairs, tables, and beds.
Consider th...
The points in the graph below represent the halts of a lift for durations of 1 minute, over a period of 1 hour.
Which of the following statements are correct?...
The total expenditure of a family, on different activities in a month, is shown in the pie-chart. The extra money spent on education as compared to transport (i...

Total Unique Visitors
Loading......