Civil Engineering > GATE 2013 > Data Interpretation
The following table provides figures (in rupees) on annual expenditure of a firm for two years - 2010 and 2011.
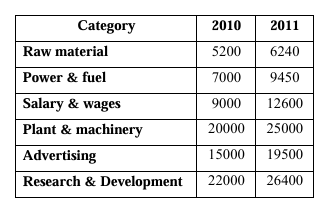 In 2011, which of the following two categories have registered an increase by the same percentage?
Correct : d
Similar Questions
The bar graph below shows the output of five carpenters over one month, each of whom made different items of furniture: chairs, tables, and beds.
Consider th...
The points in the graph below represent the halts of a lift for durations of 1 minute, over a period of 1 hour.
Which of the following statements are correct?...
The total expenditure of a family, on different activities in a month, is shown in the pie-chart. The extra money spent on education as compared to transport (i...

Total Unique Visitors
Loading......