Chemical Engineering > GATE 2020 > Data Interpretation
The profit shares of two companies P and Q are shown in the figure.
If the two companies have invested a fixed and equal amount every year, then the ratio of the total revenue of company P to the total revenue of company Q, during 2013-2018 is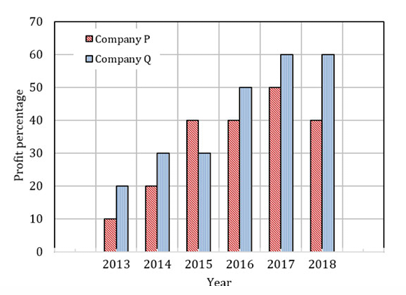
If the two companies have invested a fixed and equal amount every year, then the ratio of the total revenue of company P to the total revenue of company Q, during 2013-2018 is
Correct : b
Similar Questions
The chart given below compares the Installed Capacity (MW) of four power
generation technologies, T1, T2, T3, and T4, and their Electricity Generation
(MWh...
n the given diagram, teachers are represented in the triangle, researchers in the circle and administrators in the rectangle. Out of the total number of the peo...
In a detailed study of annual crow births in India, it was found that there was relatively no
growth during the period 2002 to 2004 and a sudden spike from 20...

Total Unique Visitors
Loading......