Chemical Engineering > GATE 2019 > Data Interpretation
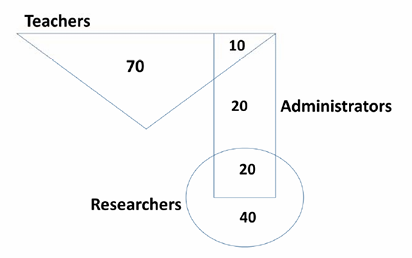
n the given diagram, teachers are represented in the triangle, researchers in the circle and administrators in the rectangle. Out of the total number of the people, the percentage of administrators shall be in the range of _________.
Correct : c
Similar Questions
The chart given below compares the Installed Capacity (MW) of four power
generation technologies, T1, T2, T3, and T4, and their Electricity Generation
(MWh...
In a detailed study of annual crow births in India, it was found that there was relatively no
growth during the period 2002 to 2004 and a sudden spike from 20...
The profit shares of two companies P and Q are shown in the figure. If the two companies have invested a fixed and equal amount every year, then the ratio of th...

Total Unique Visitors
Loading......