Chemical Engineering > GATE 2018 > Data Interpretation
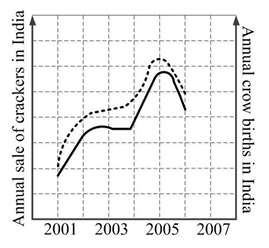
In a detailed study of annual crow births in India, it was found that there was relatively no
growth during the period 2002 to 2004 and a sudden spike from 2004 to 2005. In another
unrelated study, it was found that the revenue from cracker sales in India which remained
fairly flat from 2002 to 2004, saw a sudden spike in 2005 before declining again in 2006.
The solid line in the graph below refers to annual sale of crackers and the dashed line refers
to the annual crow births in India. Choose the most appropriate inference from the above
data.
Correct : a
Similar Questions
The chart given below compares the Installed Capacity (MW) of four power
generation technologies, T1, T2, T3, and T4, and their Electricity Generation
(MWh...
n the given diagram, teachers are represented in the triangle, researchers in the circle and administrators in the rectangle. Out of the total number of the peo...
The profit shares of two companies P and Q are shown in the figure. If the two companies have invested a fixed and equal amount every year, then the ratio of th...

Total Unique Visitors
Loading......