Chemical Engineering > GATE 2014 > Data Interpretation
The monthly rainfall chart based on 50 years of rainfall in Agra is shown in the following figure.
Which of the following are true? (k percentile is the value such that k percent of the data fall below that value)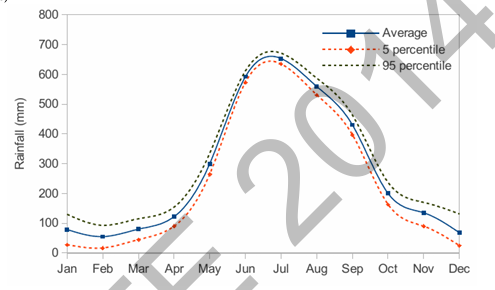 (i) On average, it rains more in July than in December
(ii) Every year, the amount of rainfall in August is more than that in January
(iii) July rainfall can be estimated with better confidence than February rainfall
(iv) In August, there is at least 500 mm of rainfall
Which of the following are true? (k percentile is the value such that k percent of the data fall below that value)
(ii) Every year, the amount of rainfall in August is more than that in January
(iii) July rainfall can be estimated with better confidence than February rainfall
(iv) In August, there is at least 500 mm of rainfall
Correct : b
Similar Questions
The chart given below compares the Installed Capacity (MW) of four power
generation technologies, T1, T2, T3, and T4, and their Electricity Generation
(MWh...
n the given diagram, teachers are represented in the triangle, researchers in the circle and administrators in the rectangle. Out of the total number of the peo...
In a detailed study of annual crow births in India, it was found that there was relatively no
growth during the period 2002 to 2004 and a sudden spike from 20...

Total Unique Visitors
Loading......