Agricultural Engineering > GATE 2020 > Numerical Ability
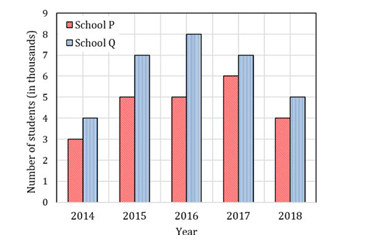
The following figure shows the data of students enrolled in 5 years (2014 to 2018) for two schools P and Q. During this period, the ratio of the average number of the students enrolled in school P to the average of the difference of the number of students enrolled in schools P and Q is
Correct : b
Similar Questions
A superadditive function f() satisfies the following propertyf(x1+x2) ≥ f(x1) + f(x2)Which of the following functions is a superadditive function for x > 1?
It is quarter past three in your watch. The angle between the hour hand and the minute hand is
A circle with centre O is shown in the figure. A rectangle PQRS of maximum possible area is inscribed in the circle. If the radius of the circle is a, then the...

Total Unique Visitors
Loading......