Agricultural Engineering > GATE 2014 > Data Interpretation
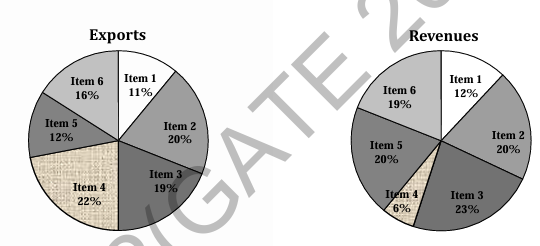
The total exports and revenues from the exports of a country are given in the two pie charts below. The pie chart for exports shows the quantity of each item as a percentage of the total quantity of exports. The pie chart for the revenues shows the percentage of the total revenue generated through export of each item. The total quantity of exports of all the items is 5 lakh tonnes and the total revenues are 250 crore rupees. What is the ratio of the revenue generated through export of Item 1 per kilogram to the revenue generated through export of Item 4 per kilogram?
Correct : d
Similar Questions
Two finance companies, P and Q, declared fixed annual rates of interest on the amounts invested
with them. The rates of interest offered by these companies ma...
Fill in the missing value [Graph or data implied for numerical answer].
Following table gives data on tourists from different countries visiting India in the year 2011. Which two countries contributed to the one third of the total n...

Total Unique Visitors
Loading......