Aerospace Engineering > GATE 2014 > Line Graph
The monthly rainfall chart based on 50 years of rainfall in Agra is shown in the following figure. Which of the following are true? (k percentile is the value such that k percent of the data fall below that value)
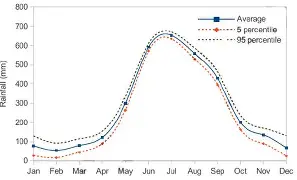 (i) On average, it rains mor more in July than in December
(ii) Every year, the amount of rainfall in August is more than that in January
(iii) July rainfall can be be estimated with better confidence than February rainfall
(iv) In August, there is at least 500 mm of rainfall
(ii) Every year, the amount of rainfall in August is more than that in January
(iii) July rainfall can be be estimated with better confidence than February rainfall
(iv) In August, there is at least 500 mm of rainfall
Correct : b
Similar Questions
If → denotes increasing order of intensity, then the meaning of the words dry → arid → parched is analogous to diet → fast → ______. Which one of the given opt...
If two positive non-zero real variables x and y are such that (x+y) is proportional to x/y, then x+y:
Consider the following sample of numbers: 9, 18, 11, 14, 15, 17, 10, 69, 11, 13. The median of the sample is

Total Unique Visitors
Loading......