Basic Mathematics
Number System LCM & HCF Percentage Ratio & Proportion Average Simple InterestBusiness Mathematics
Profit & Loss Compound Interest Partnership Discount Stocks & Shares BankingTime, Work & Motion
Time & Work Pipes & Cisterns Time, Speed & Distance Trains Boats & Streams RacesAdvanced Mathematics
Algebra Geometry Mensuration Trigonometry Logarithms & Indices Coordinate GeometryStatistics & Probability
Statistics Probability Permutation Combination Set Theory Data InterpretationData Interpretation Aptitude Questions & Formulas with answer
Ques 41 GATE 2014
The monthly rainfall chart based on 50 years of rainfall in Agra is shown in the following figure.
Which of the following are true? (k percentile is the value such that k percent of the data fall below that value)
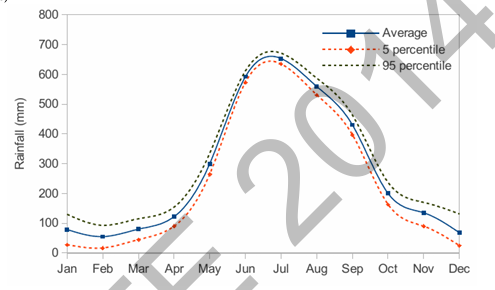
(ii) Every year, the amount of rainfall in August is more than that in January
(iii) July rainfall can be estimated with better confidence than February rainfall
(iv) In August, there is at least 500 mm of rainfall
(b) is the correct answer.
Ques 42 GATE 2014
The total exports and revenues from the exports of a country are given in the two pie charts below. The pie chart for exports shows the quantity of each item as a percentage of the total quantity of exports. The pie chart for the revenues shows the percentage of the total revenue generated through export of each item. The total quantity of exports of all the items is 5 lakh tonnes and the total revenues are 250 crore rupees. What is the ratio of the revenue generated through export of Item 1 per kilogram to the revenue generated through export of Item 4 per kilogram?
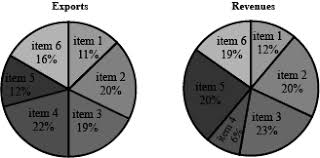
(d) is the correct answer.
Ques 43 GATE 2013
Following table gives data on tourists from different countries visiting India in the year 2011. Which two countries contributed to the one third of the total number of tourists who visited India in 2011?
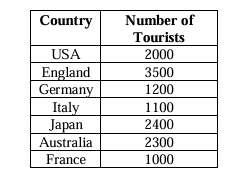
(a) is the correct answer.
Ques 44 GATE 2013
Following table gives data on tourists from different countries visiting India in the year 2011.
| Country | Number of Tourists |
|---|---|
| USA | 2000 |
| England | 3500 |
| Germany | 1200 |
| Italy | 1100 |
| Japan | 2400 |
| Australia | 2300 |
| France | 1000 |
Which two countries contributed to the one third of the total number of tourists who visited India in 2011?
(d) is the correct answer.
Ques 45 GATE 2013
The following table provides figures (in rupees) on annual expenditure of a firm for two years - 2010 and 2011.
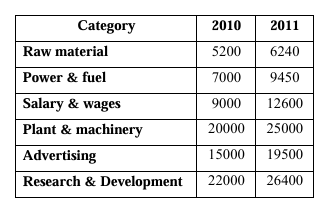
(d) is the correct answer.
Ques 46 GATE 2011
Four archers P, Q, R and S try to hit a bull's eye during a tournament consisting of seven rounds.
As illustrated in the figure below, a player receives 10 points for hitting the bulls' eye, 5 points for
hitting within the inner circle and 1 point for hitting within the outer circle.
The final scores received by the players during the tournament are listed in the table below.
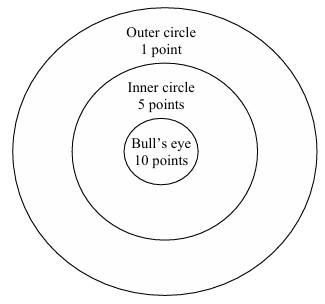
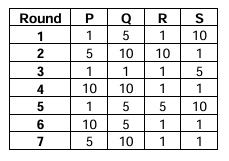
(b) is the correct answer.
Ques 47 GATE 2011
P, Q, R and S are four types of dangerous microbes recently found in a human habitat. The area of each circle with its diameter printed in brackets represents the growth of a single microbe surviving human immunity system within 24 hours of entering the body. The danger to human beings varies proportionately with the toxicity, potency and growth attributed to a microbe shown in the figure below:
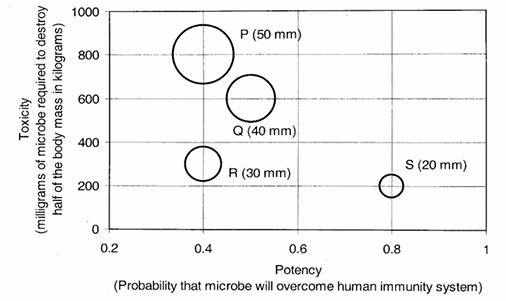
(d) is the correct answer.
Ques 48 GATE 2011
The quality of services delivered by a company consists of six factors as shown below in the radar diagram. The dots in the figure indicate the score for each factor on a scale of 0 to 10. The standardized coefficient for each factor is given in the parentheses. The contribution of each factor to the overall service quality is directly proportional to the factor score and its standardized coefficient.
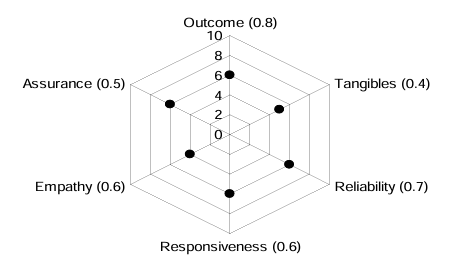
(b) is the correct answer.