Basic Mathematics
Number System LCM & HCF Percentage Ratio & Proportion Average Simple InterestBusiness Mathematics
Profit & Loss Compound Interest Partnership Discount Stocks & Shares BankingTime, Work & Motion
Time & Work Pipes & Cisterns Time, Speed & Distance Trains Boats & Streams RacesAdvanced Mathematics
Algebra Geometry Mensuration Trigonometry Logarithms & Indices Coordinate GeometryStatistics & Probability
Statistics Probability Permutation Combination Set Theory Data InterpretationData Interpretation Aptitude Questions & Formulas with answer
Ques 21 GATE 2016 SET-3
The Venn diagram shows the preference of the student population for leisure activities. From the data given, the number of students who like to read books or play sports is
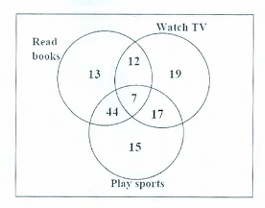
(d) is the correct answer.
Ques 22 GATE 2016 SET-2
The following graph represents the installed capacity for cement production (in tonnes) and the actual production (in tonnes) of nine cement plants of a cement company. Capacity utilization of a plant is defined as ratio of actual production of cement to installed capacity. A plant with installed capacity of at least 200 tonnes is called a large plant and a plant with lesser capacity is called a small plant. The difference between total production of large plants and small plants, in tonnes is ________.
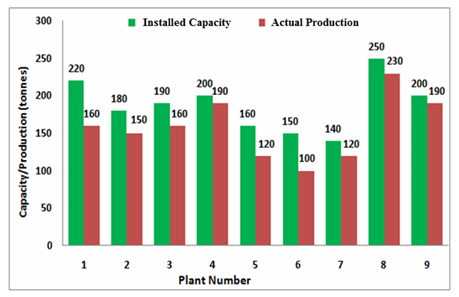
(160) is the correct answer.
Ques 23 GATE 2016 SET-2
Students taking an exam are divided into two groups, P and Q such that each group has the same number of students. The performance of each of the students in a test was evaluated out of 200 marks. It was observed that the mean of group P was 105, while that of group Q was 85. The standard deviation of group P was 25, while that of group Q was 5. Assuming that the marks were distributed on a normal distribution, which of the following statements will have the highest probability of being TRUE?
(c) is the correct answer.
Ques 24 GATE 2016 SET-1
A shaving set company sells 4 different types of razors, Elegance, Smooth, Soft and Executive. Elegance sells at Rs. 48, Smooth at Rs. 63, Soft at Rs. 78 and Executive at Rs. 173 per piece. The table below shows the numbers of each razor sold in each quarter of a year.
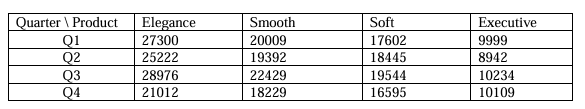
(b) is the correct answer.
Ques 25 GATE 2016
Two finance companies, P and Q, declared fixed annual rates of interest on the amounts invested with them. The rates of interest offered by these companies may differ from year to year. Year-wise annual rates of interest offered by these companies are shown by the line graph provided below.
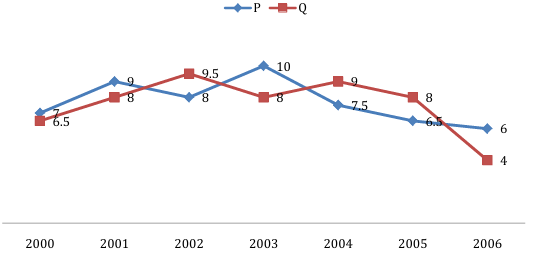
(d) is the correct answer.
Ques 26 GATE 2016
The following graph represents the installed capacity for cement production (in tonnes) and the actual production (in tonnes) of nine cement plants of a cement company. Capacity utilization of a plant is defined as ratio of actual production of cement to installed capacity. A plant with installed capacity of at least 200 tonnes is called a large plant and a plant with lesser capacity is called a small plant. The difference between total production of large plants and small plants, in tonnes is
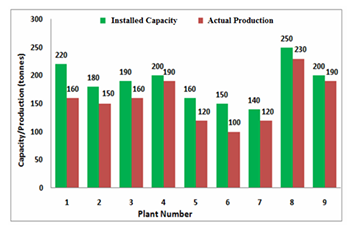
(120: 120) is the correct answer.
Ques 27 GATE 2015 SET-2
Read the following table giving sales data of five types of batteries for years 2006 to 2012:
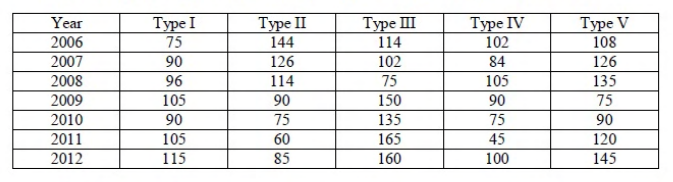
(b) is the correct answer.
Ques 28 GATE 2015 SET-1
The exports and imports (in crores of Rs.) of a country from the year 2000 to 2007 are given in the following bar chart. In which year is the combined percentage increase in imports and exports the highest?
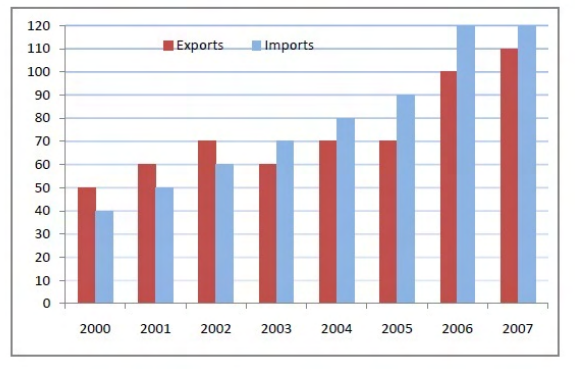
(2006) is the correct answer.
Ques 29 GATE 2015 SET-1
The pie chart below has the breakup of the number of students from different departments in an engineering college for the year 2012. The proportion of male to female students in each department is 5:4. There are 40 males in Electrical Engineering. What is the difference between the numbers of female students in the Civil department and the female students in the Mechanical department?
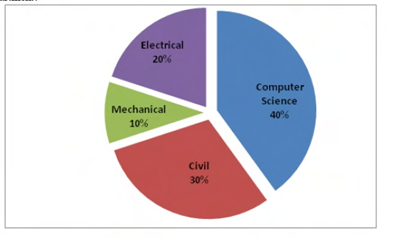
(32) is the correct answer.
Ques 30 GATE 2015 SET-1
The number of students in a class who have answered correctly, wrongly, or not attempted each question in an exam, are listed in the table below. The marks for each question are also listed. There is no negative or partial marking.
| Q No. | Marks | Answered Correctly | Answered Wrongly | Not Attempted |
| 1 | 2 | 21 | 17 | 6 |
| 2 | 3 | 15 | 27 | 2 |
| 3 | 1 | 11 | 29 | 4 |
| 4 | 2 | 23 | 18 | 3 |
| 5 | 5 | 31 | 12 | 1 |
What is the average of the marks obtained by the class in the examination?
(b) is the correct answer.
Ques 31 GATE 2015 SET-1
An electric bus has onboard instruments that report the total electricity consumed since the start of the trip as well as the total distance covered. During a single day of operation, the bus travels on stretches M, N, O, and P, in that order. The cumulative distances travelled and the corresponding electricity consumption are shown in the Table below:
| Stretch | Cumulative distance (km) | Electricity used (kWh) |
| M | 20 | 12 |
| N | 45 | 25 |
| O | 75 | 45 |
| P | 100 | 57 |
The stretch where the electricity consumption per km is minimum is
(d) is the correct answer.
Ques 32 GATE 2015
Fill in the missing value [Graph or data implied for numerical answer].

(3) is the correct answer.
Ques 33 GATE 2014 SET-4
A firm producing air purifiers sold 200 units in 2012. The following pie chart presents the share of raw material, labour, energy, plant & machinery, and transportation costs in the total manufacturing cost of the firm in 2012. The expenditure on labour in 2012 is Rs. 4,50,000. In 2013, the raw material expenses increased by 30% and all other expenses increased by 20%. What is the percentage increase in total cost for the company in 2013?
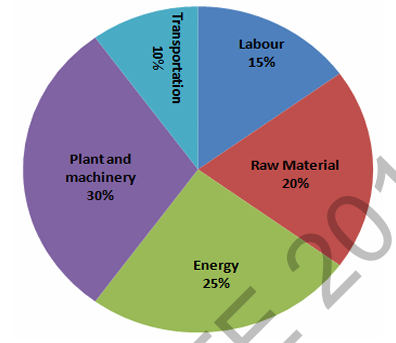
(22) is the correct answer.