Basic Mathematics
Number System LCM & HCF Percentage Ratio & Proportion Average Simple InterestBusiness Mathematics
Profit & Loss Compound Interest Partnership Discount Stocks & Shares BankingTime, Work & Motion
Time & Work Pipes & Cisterns Time, Speed & Distance Trains Boats & Streams RacesAdvanced Mathematics
Algebra Geometry Mensuration Trigonometry Logarithms & Indices Coordinate GeometryStatistics & Probability
Statistics Probability Permutation Combination Set Theory Data InterpretationData Interpretation Aptitude Questions & Formulas with answer
Ques 1 GATE 2025 SET-2
A bag contains Violet (V), Yellow (Y), Red (R), and Green (G) balls. On counting them, the following results are obtained:
(i) The sum of Yellow balls and twice the number of Violet balls is 50.
(ii) The sum of Violet and Green balls is 50.
(iii) The sum of Yellow and Red balls is 50.
(iv) The sum of Violet and twice the number of Red balls is 50.
Which one of the following Pie charts correctly represents the balls in the bag?
(a) is the correct answer.
Ques 2 GATE 2025
A 4×4 digital image has pixel intensities (U) as shown in the figure. The number of pixels with U≤4 is:

(c) is the correct answer.
Ques 3 GATE 2025
The number of patients per shift (X) consulting Dr. Gita in her past 100 shifts is shown in the figure. If the amount she earns is ¥1000(X-0.2), what is the average amount (in ¥) she has earned per shift in the past 100 shifts?
Note: The figure shown is representative.

(a) is the correct answer.
Ques 4 GATE 2025
The table lists the top 5 nations according to the number of gold medals won in a tournament; also included are the number of silver and the bronze medals won by them. Based only on the data provided in the table, which one of the following statements is INCORRECT?
| Nation | Gold | Silver | Bronze |
| USA | 40 | 44 | 41 |
| Canada | 39 | 24 | 27 |
| Japan | 20 | 12 | 13 |
| Australia | 17 | 16 | 19 |
| France | 16 | 26 | 22 |
(a) is the correct answer.
Ques 5 GATE 2025
The table lists the top 5 nations according to the number of gold medals won in a tournament; also included are the number of silver and the bronze medals won by them. Based only on the data provided in the table, which one of the following statements is INCORRECT?
| Nation | Gold | Silver | Bronze |
| USA | 40 | 44 | 41 |
| Canada | 39 | 24 | 27 |
| Japan | 20 | 12 | 13 |
| Australia | 19 | 17 | 16 |
| France | 16 | 26 | 22 |
(a) is the correct answer.
Ques 6 GATE 2025
A bag contains Violet (V), Yellow (Y), Red (R), and Green (G) balls. On counting them, the following results are obtained:
(i) The sum of Yellow balls and twice the number of Violet balls is 50.
(ii) The sum of Violet and Green balls is 50.
(iii) The sum of Yellow and Red balls is 50.
(iv) The sum of Violet and twice the number of Red balls is 50.
Which one of the following Pie charts correctly represents the balls in the bag?
(a) is the correct answer.
Ques 7 GATE 2024 SET-2
The plot below shows the relationship between the mortality risk of cardiovascular disease and the number of steps a person walks per day. Based on the data, which one of the following options is true?
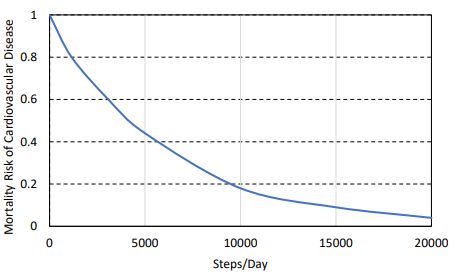
(c) is the correct answer.
Ques 8 GATE 2024 SET-1
The chart given below compares the Installed Capacity (MW) of four power generation technologies, T1, T2, T3, and T4, and their Electricity Generation (MWh) in a time of 1000 hours (h).
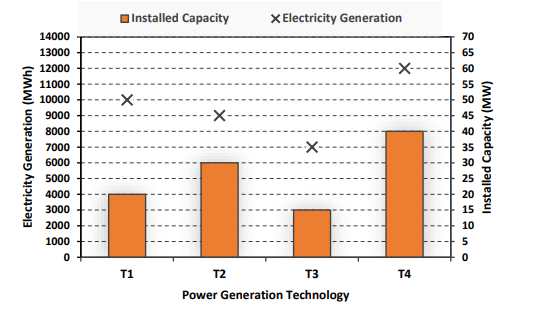
Capacity Factor = Electricity Generation (MWh) / Installed Capacity (MW) x 1000 (h).
Which one of the given technologies has the highest Capacity Factor?
(a) is the correct answer.
Ques 9 GATE 2024
The pie chart presents the percentage contribution of different macronutrients to a typical 2,000 kcal diet of a person.


(a) is the correct answer.
Ques 10 GATE 2024
The pie chart presents the percentage contribution of different macronutrients to a typical 2,000 kcal diet of a person.


(b) is the correct answer.
Ques 11 GATE 2024
The chart given below compares the Installed Capacity (MW) of four power generation technologies, T1, T2, T3, and T4, and their Electricity Generation (MWh) in a time of 1000 hours (h).

Capacity Factor= Electricity Generation (MWh)/ Installed Capacity (MW) × 1000 (h)
Which one of the given technologies has the highest Capacity Factor?
(d) is the correct answer.
Ques 12 GATE 2024
The pie chart presents the percentage contribution of different macronutrients to a
typical 2,000 kcal diet of a person.
(b) is the correct answer.
Ques 13 GATE 2023
A survey for a certain year found that 90% of pregnant women received medical care at least once before giving birth. Of these women, 60% received medical care from doctors, while 40% received medical care from other healthcare providers. Given this information, which one of the following statements can be inferred with certainty?
(a) is the correct answer.